Vital Signs
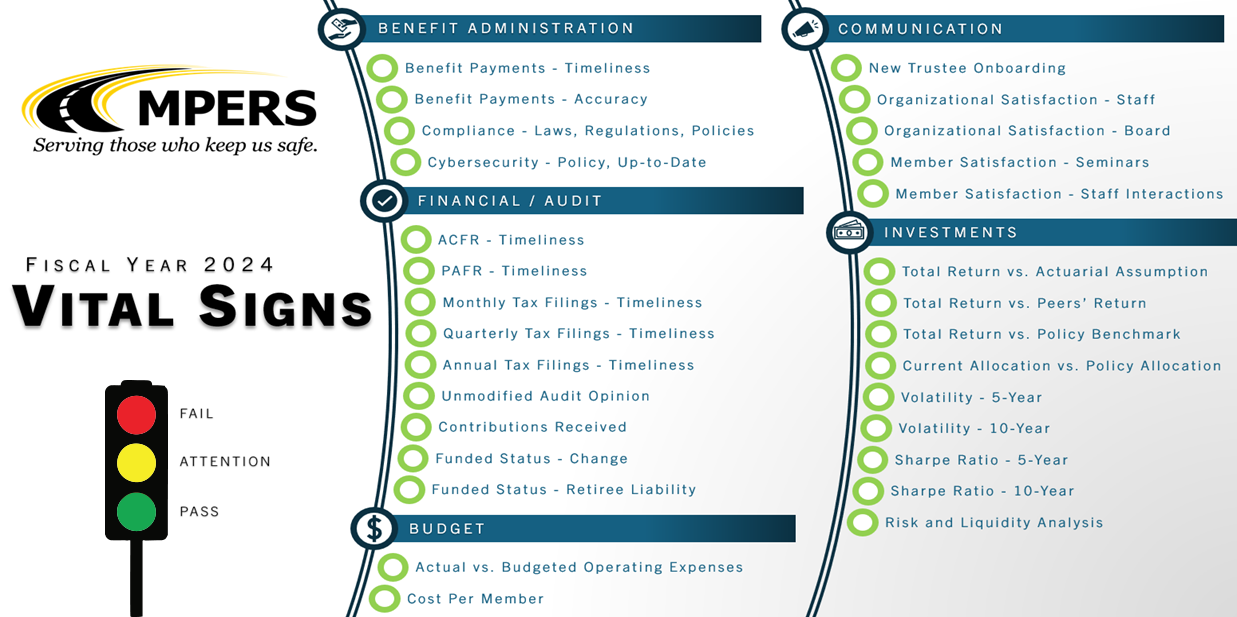
In 2020, MPERS implemented an oversight tool called vital signs. This tool was intended to improve the MPERS Board’s insight into System performance. As is the case with most organizations, there are numerous performance metrics to evaluate success and failure. MPERS is no exception. Historically, a very detailed approach to oversight was MPERS’ practice. This resulted in voluminous amounts of information, which was both distracting and overwhelming. To focus attention on the most important measurements, the Board of Trustees embraced the concept of identifying the vital signs for MPERS’ vital functions.
Much like the vital signs used to assess your personal health, MPERS’ vital signs provide an at-a-glance view of how the organization is performing. This narrowly focused list of vital signs tells the Board whether overall System performance matches its expectations.
During development of the vital signs, an analysis was performed for each vital sign that developed a range of possible outcomes for each vital sign. Some of the outcomes are simply pass or fail while others provide a range of results that are either meeting expectations, not meeting expectations, or somewhere in between. These outcomes are illustrated using the stoplight color model; green is as expected or good, yellow is cautionary or of concern, and red is unexpected or bad. The outcome for each vital sign is color coded based on this simple and familiar model to quickly draw attention to areas not performing as expected, or alternatively, performance is as expected.
Vital signs are reported to the Board at least annually and are reviewed and assessed on that same schedule to be sure they remain sufficient so the Board can maintain effective and responsible oversight. Staff is developing a dashboard for reporting and maintaining a historical reference of these outcomes. The list below is a temporary dashboard until something more dynamic can be shared with stakeholders. This dashboard will be particularly useful in identifying outcomes that require review, especially when they either reoccur for a specific sign or there is downward experience for a particular vital sign. The ability to view trends (both upward and downward) will be useful to the Board and stakeholders.
The vital signs are reviewed annually by the external auditor to reinforce the validity of each outcome.
Select the image below to open the vital signs dashboard.
Benefit payments are evaluated on a pass/fail basis.
Green indicates pass, red indicates fail.
Compliance with laws, regulations, and policies are evaluated on a pass/fail basis.
Green indicates pass, red indicates fail.
Cybersecurity policies are reviewed, improved upon, and implemented.
Green indicates pass, red indicates fail.
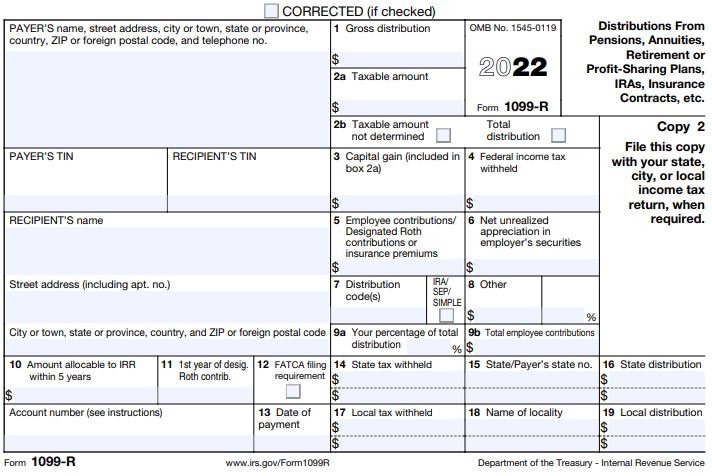
MPERS must meet mandatory tax filing periods.
Green indicates pass, red indicates fail.
Did covered employers contribute 100% of the mandatory contribution rate?
Green indicates pass, red indicates fail.
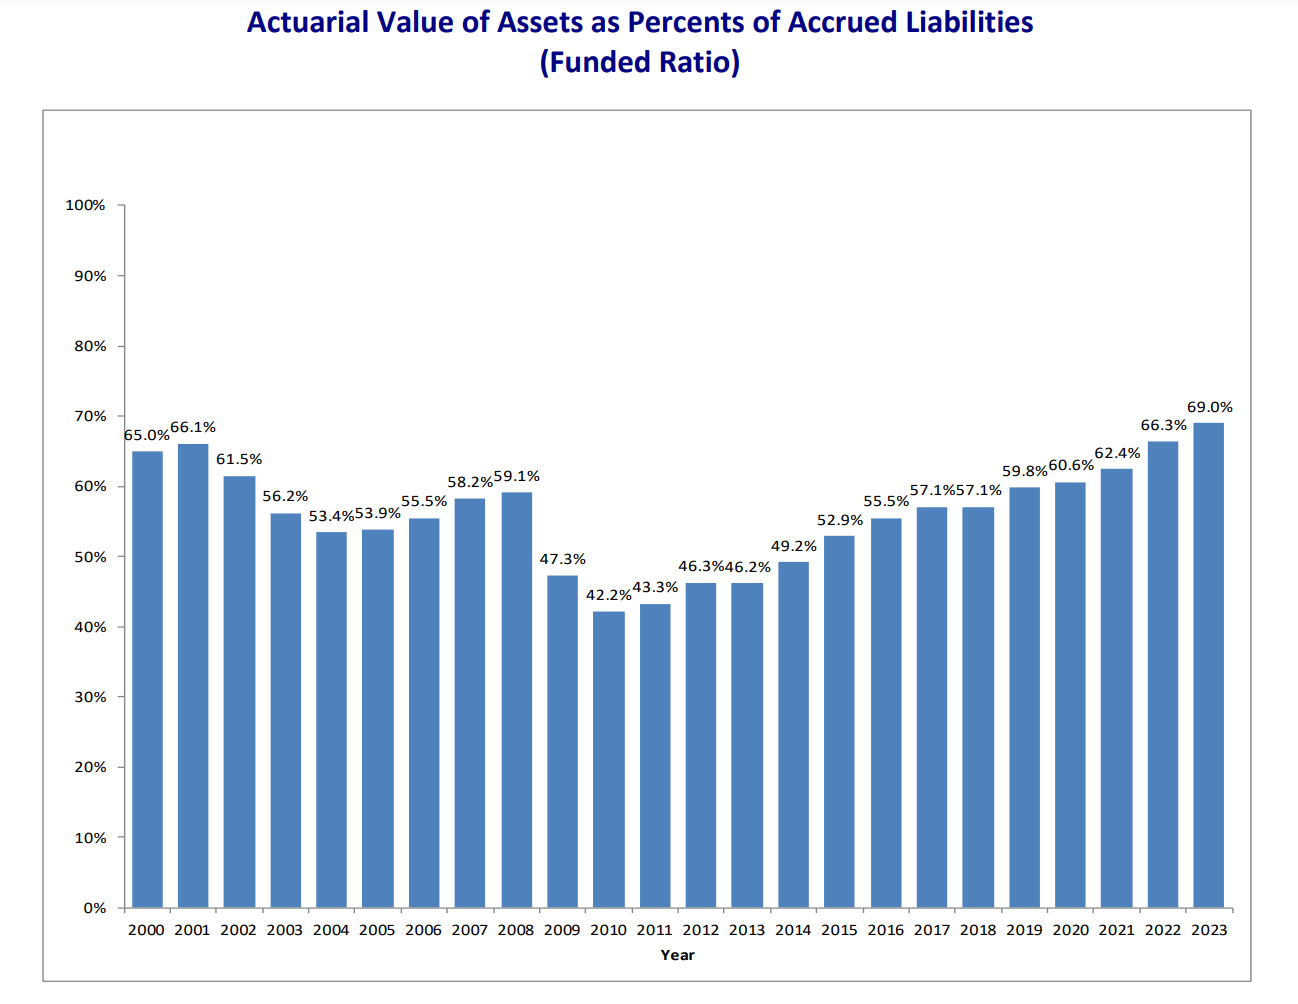
Green indicates any increase in funded status.
Yellow indicates a decrease of 2% or less.
Red indicates a decrease of more than 2%.
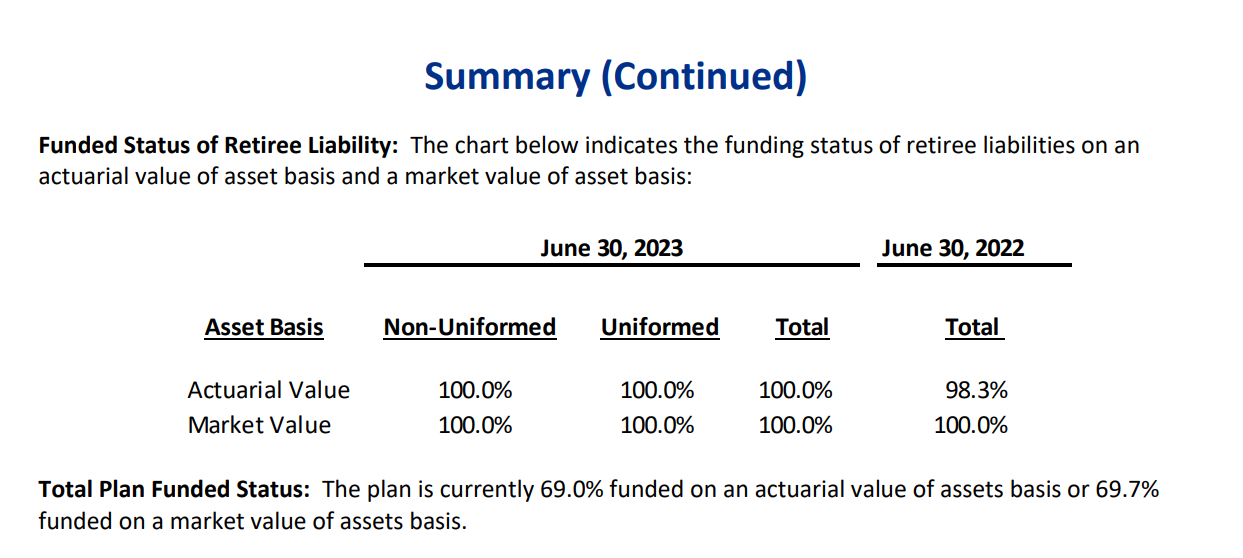
Is the retiree liability fully funded?
Green indicates pass, red indicates fail.
Actual expenditures versus budgeted expenditures.
Green indicates MPERS was below the total approved budget.
Yellow indicates MPERS was within 2% above the total approved budget.
Red indicates MPERS was was more than 2% above the total approved budget.
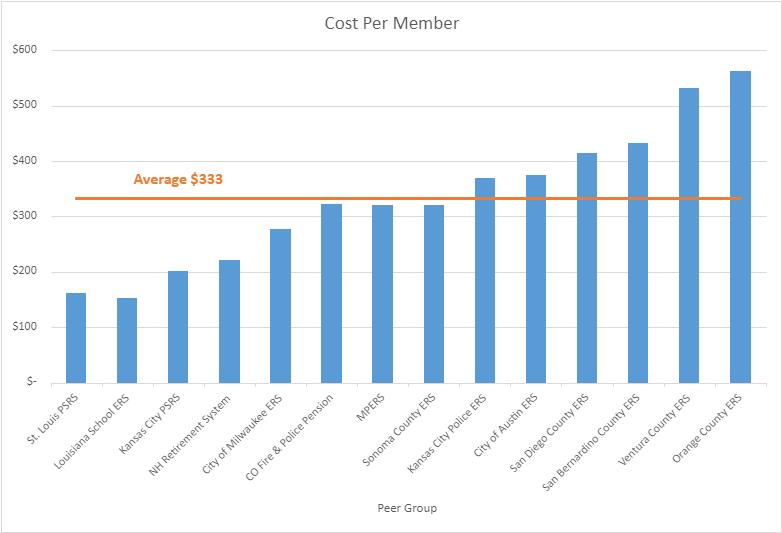
MPERS conducts an annual analysis that compares the MPERS cost per member to the cost per member of similar systems.
Green indicates MPERS is below their peer average.
Yellow indicates MPERS is within 5% above their peer average.
Red indicates MPERS is more than 5% above their peer average.
MPERS conducts onboarding sessions for new trustees. The new trustee will assign a green, yellow, or red designations.
Green indicates met expectations.
Yellow indicates incomplete or came up short of expectations.
Red indicates failure to meet expectations.
Annually, MPERS surveys its’ employees to gauge organizational satisfaction.
On a scale of 1-3 with three being satisfied and one being unsatisfied:
Green is indicated by a score of 2-3.
Yellow is indicated by a score of 1-1.99.
Red is indicated by a score of 1 or below.
MPERS conducts surveys of all members who attend pre-retirement and mid-career seminars.
Green is indicated by a score of 95% or greater, good/excellent.
Yellow is indicated by a score of 90% – 95% good/excellent.
Red is indicated by a score of 90% or below.
MPERS conducts surveys of all members who interact with our staff via phone, email, personal counseling sessions, etc.
Green is indicated by a score of 95% or greater, good/excellent.
Yellow is indicated by a score of 90% – 95% good/excellent.
Red is indicated by a score of 90% or below.

MPERS total investment return is the actual return, net of fees, compared to the actuarially assumed rate of return.
Green indicates a total above actuarial assumption.
Yellow indicates a total return within 1% below actuarial assumption.
Red indicates a total return more than 1% below actuarial assumption.

MPERS total investment return is the actual return, net of fees, received in a fiscal year. This return is compared to the peer universe.
Green indicates a total return exceeding the peer median.
Yellow indicates a total return within 50 basis points* below the peer median.
Red indicates a total return more than 50 basis points below the peer median.
*Basis points are a unit of measurement used in finance and investing. One basis point equals one hundredth of one percent.

MPERS total investment return is the actual return, net of fees, received in a fiscal year. This return is compared to the MPERS Board of Trustees approved policy benchmark*.
Green indicates a total return exceeding the policy benchmark.
Yellow indicates a total return within 0-50 basis points** below the policy benchmark.
Red indicates a total return more than 50 basis points below the policy benchmark.
*A benchmark is a point of reference in which something else can be measured.
** Basis points are a unit of measurement used in finance and investing. One basis point equals one hundredth of one percent.
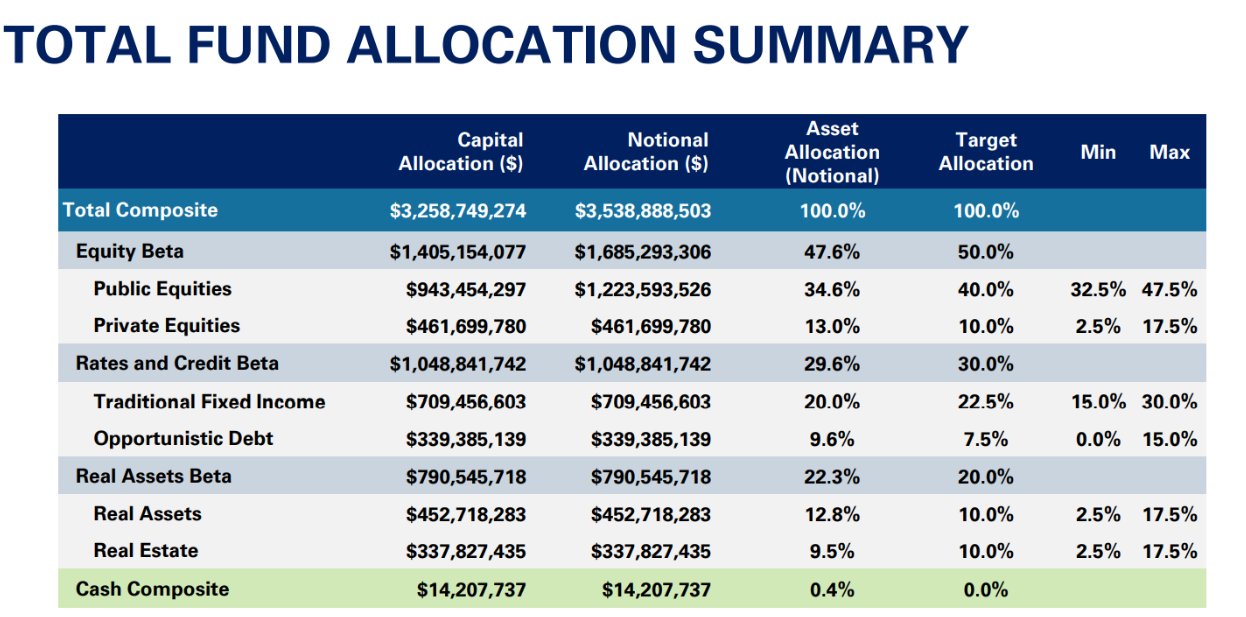
Is the actual asset allocation within the parameters of the Board approved policy allocation?
Green indicates the current allocation is within a reasonable range of the policy allocation.
Red indicates the current allocation is not within a reasonable range of the policy allocation.
Green indicates a volatility measure below the peer median.
Red indicates a volatility measure above the peer median.
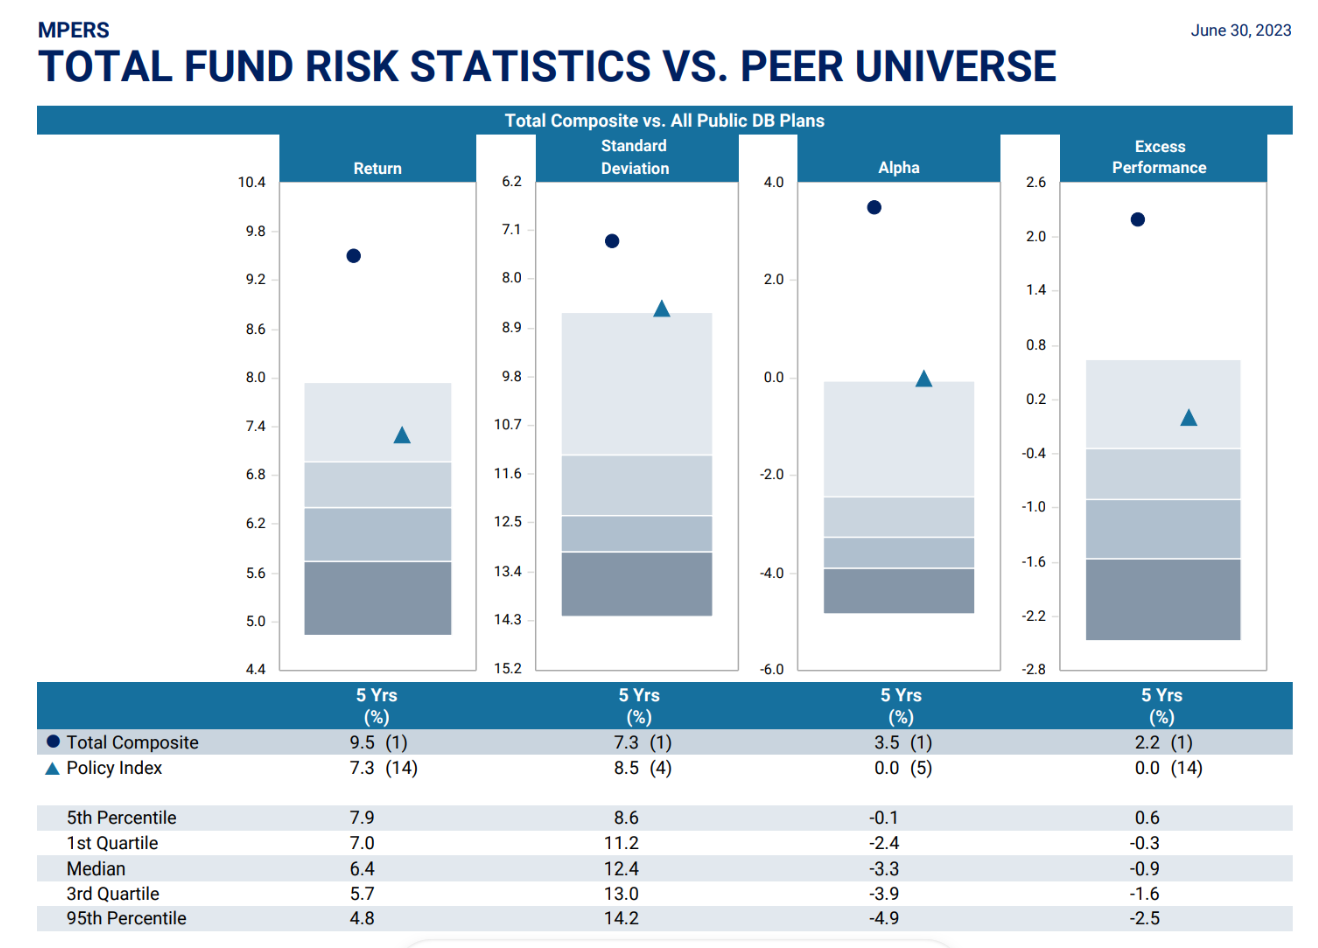
Green indicates a volatility measure below the peer median.
Red indicates a volatility measure above the peer median.
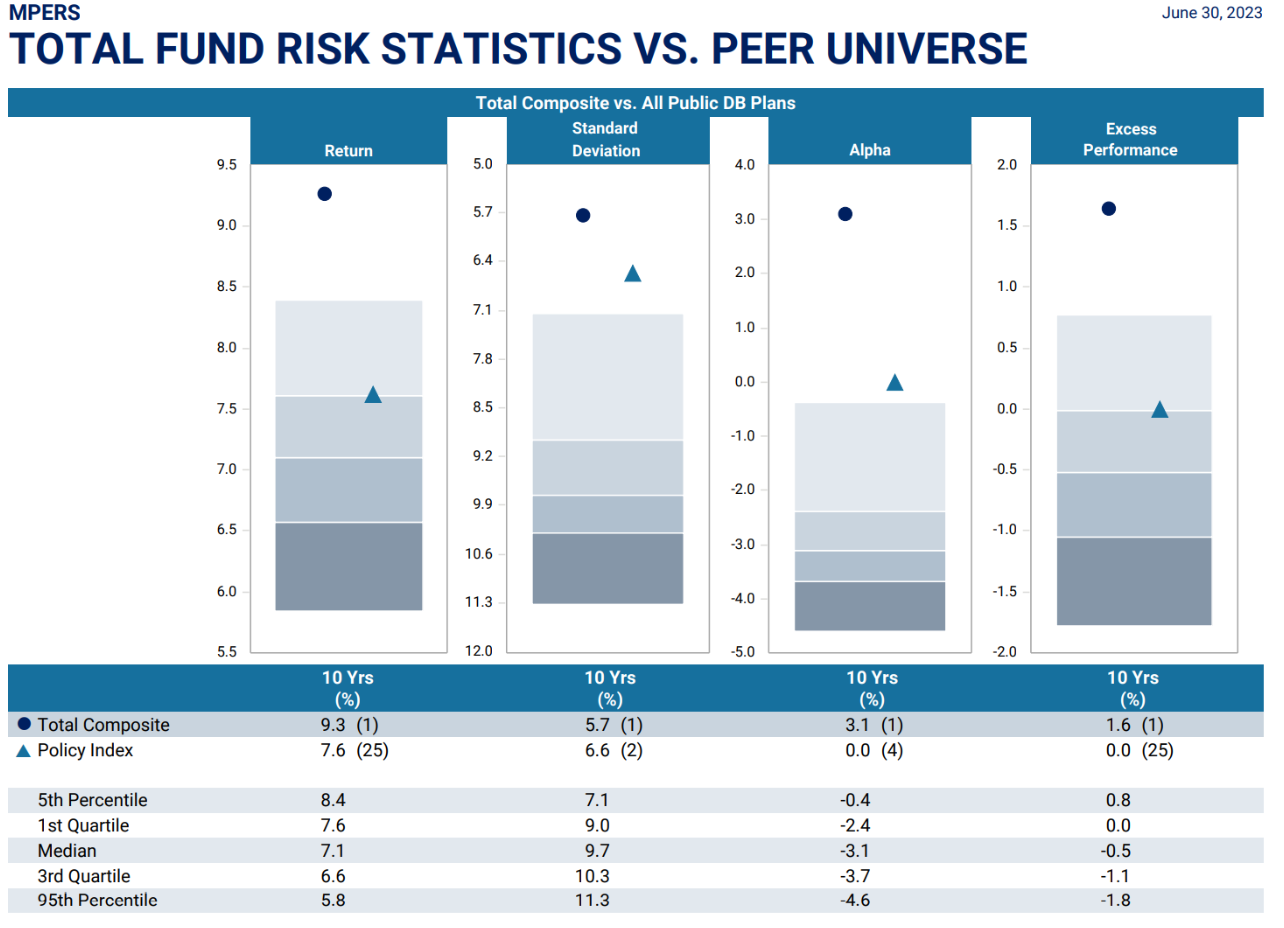
Green indicates a volatility measure below the peer median.
Red indicates a volatility measure above the peer median.
Green indicates a Sharpe Ratio above the peer median.
Red indicates a Sharpe Ratio below the peer median.
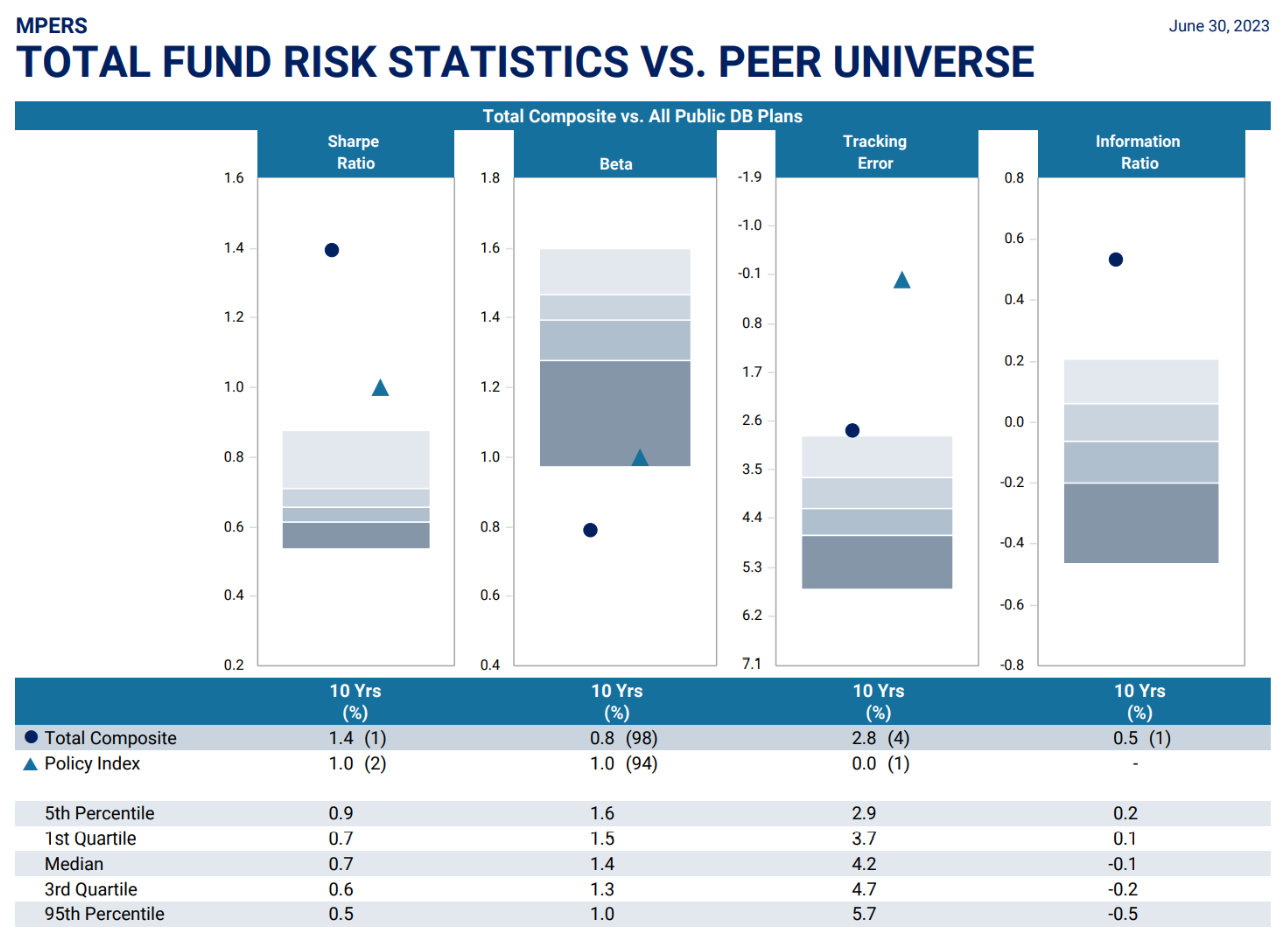
Green indicates a Sharpe Ratio above the peer median.
Red indicates a Sharpe Ratio below the peer median.
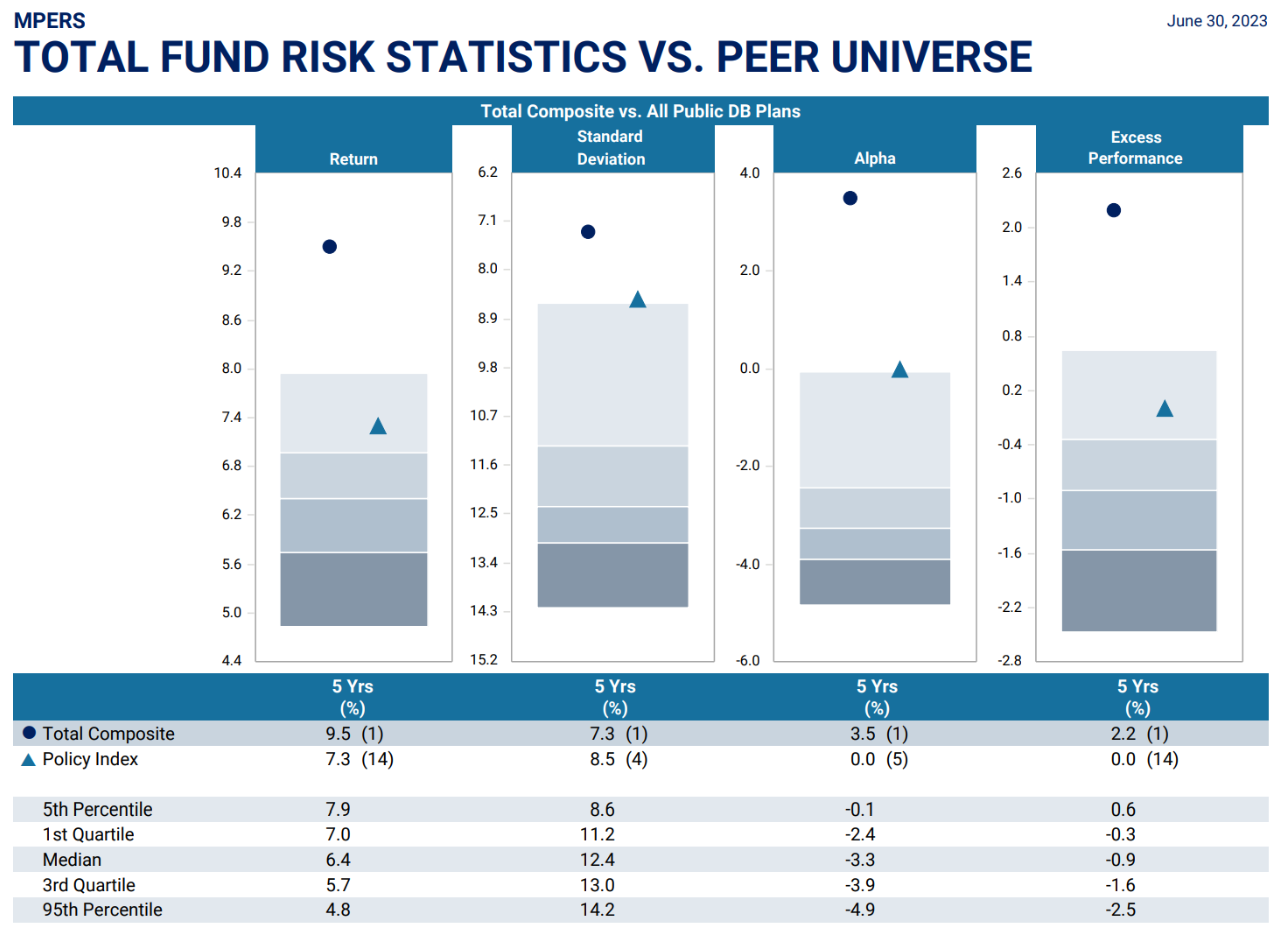
Green indicates a Sharpe Ratio above the peer median.
Red indicates a Sharpe Ratio below the peer median.
Has the risk and liquidity analysis been completed?
Green indicates pass, red indicates fail.

