We received this comment from a member during a recent survey of how we were doing as a retirement system:
MPERS expense/overhead seems excessive. It is crucial that MPERS be frugal when it comes to expenses.
What usually gets the most attention are the expenses associated with our general operating budget, which is more familiar to most individuals and provides a better comparison to corresponding budgets for employers like MoDOT and the Highway Patrol. The general operating budget, as you might expect, includes salaries and benefits, member education, supplies, building expenses, and equipment to name a few.
What is not included in the general operating budget but makes up, by far, the greatest cost for the System are investment management expenses relating to the investment of the assets used to pay benefits for plan beneficiaries. Investment expenses for fiscal year 2016 were almost $25 million—that is roughly 1% for $2 billion in assets. These investment expenses can vary greatly from one year to the next depending on market conditions. Because these fees are very unpredictable and are charged against the assets invested rather than by us “writing a check” as is the case for the general operating budget, these costs are not part of the normal operating budget. That does not mean they are not important costs, clearly they are. Each investment manager relationship includes a fee negotiation to be sure we obtain the best fee structure possible.
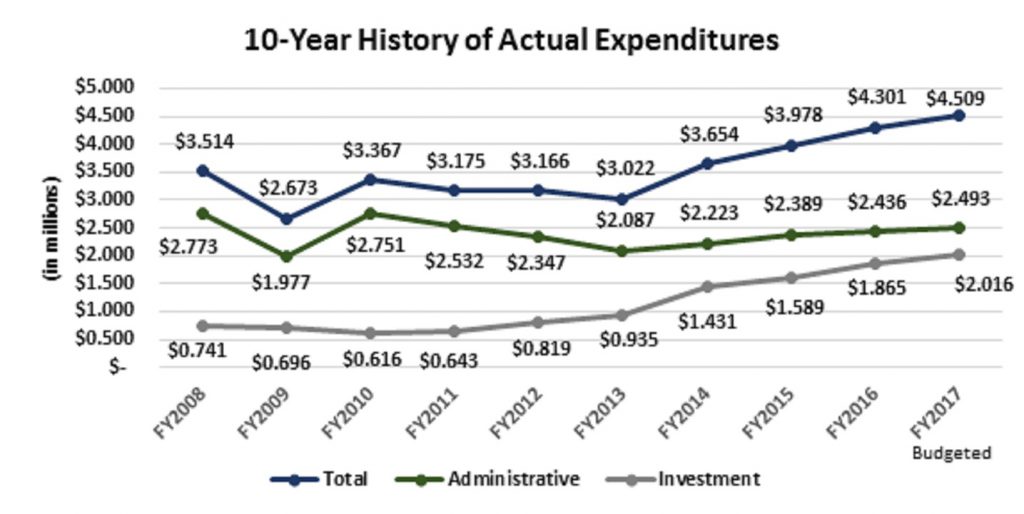
As surprising as it may seem, our frugality, or lack thereof, is usually judged on the expenses included in the general operating budget. Simply looking at the total expenses of the system does not provide a complete picture. When comparing the approved budget for FY2017 with the actual expenses of FY2008 you will see nearly a 28% increase over that 10-year period. Coincidentally, the overall state budget increased by 27% during that same time period. That may or may not seem unreasonable given that the cost of doing business, across most industries, has gone up over that time period. Below is a snapshot of MPERS’ 10-year actual expenses.
Looking at the chart, it may be surprising to see the administrative costs for MPERS are actually lower today than they were 10 years ago, while the investment side of our operation has increased significantly. Prior to hiring our first Chief Investment Officer in 2003, MPERS’ investment performance was among the poorest in the public fund peer universe. Over the past 10 years, MPERS has grown the investment staff from a staff of one to a four-person shop. This “investment” in staff has drastically improved our performance and MPERS now ranks among the best performing public funds in the country.
This is only a brief explanation of what it costs to run MPERS. For a more detailed view on actual expenses you may look through our annual financial reports that provide considerably more detail than reflected here. Managing costs is a primary responsibility of staff and the Board of Trustees. If you know the history of MPERS, you know the appropriate resources were not always available to support optimal results. Today, our resources are considerably better but that does not mean our Board has allowed an open checkbook mentality. We spend our resources wisely, recognizing that many times you get what you pay for. With that being said, we expect to deliver competitive, if not the best, results for our members.

